









 New feature
Watch every site in a multisite network
ModuleFest Cron Monitor 1.15 brings multisite support. Run every site's scheduled tasks from one real cron trigger, see each site's health on one screen in Network Admin, set alerts and limits once for the whole network, and get one weekly email that lists only the sites that need a look.
Every site on one screen
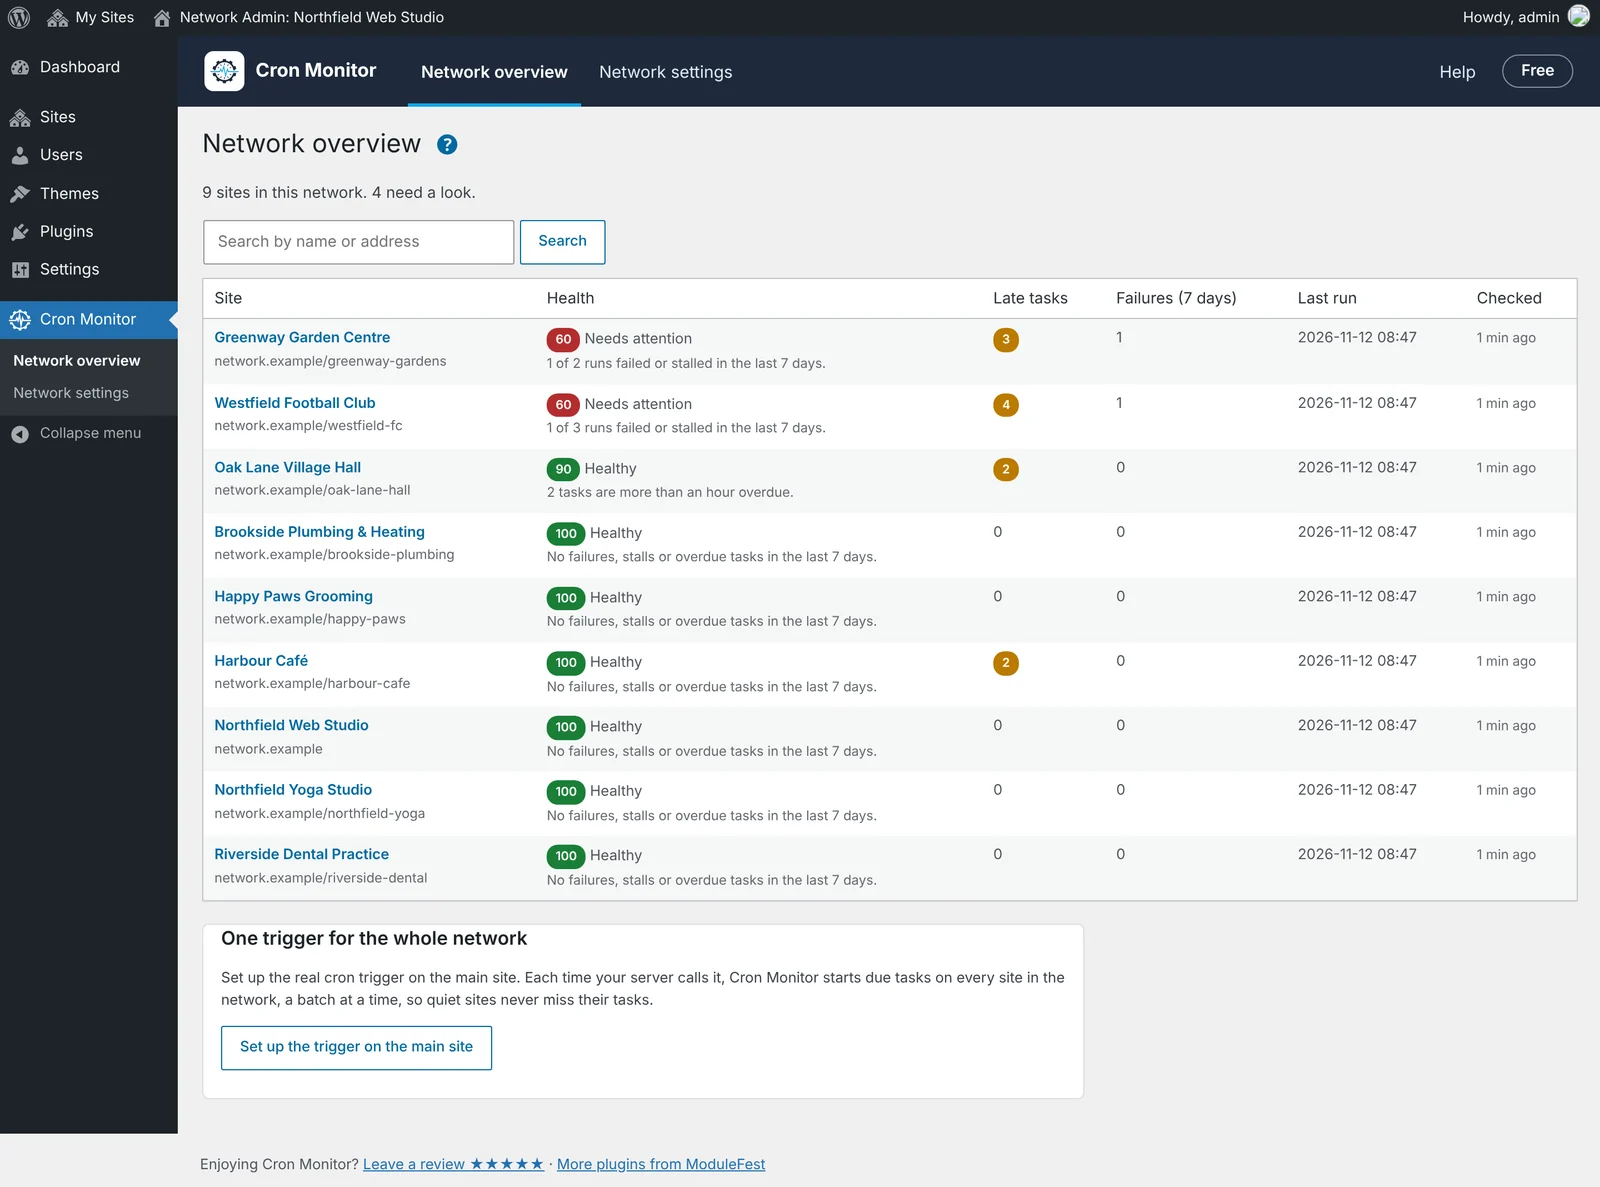
Network Admin › Cron Monitor lists every site in your network with its health score, late tasks, failures in the last 7 days and when its tasks last ran. The least healthy sites come first, so the ones that need a look are at the top.
- A health score for each site, with the reason in plain words.
- Late tasks and failures counted for every site.
- Open any site's own Cron Monitor straight from its row.
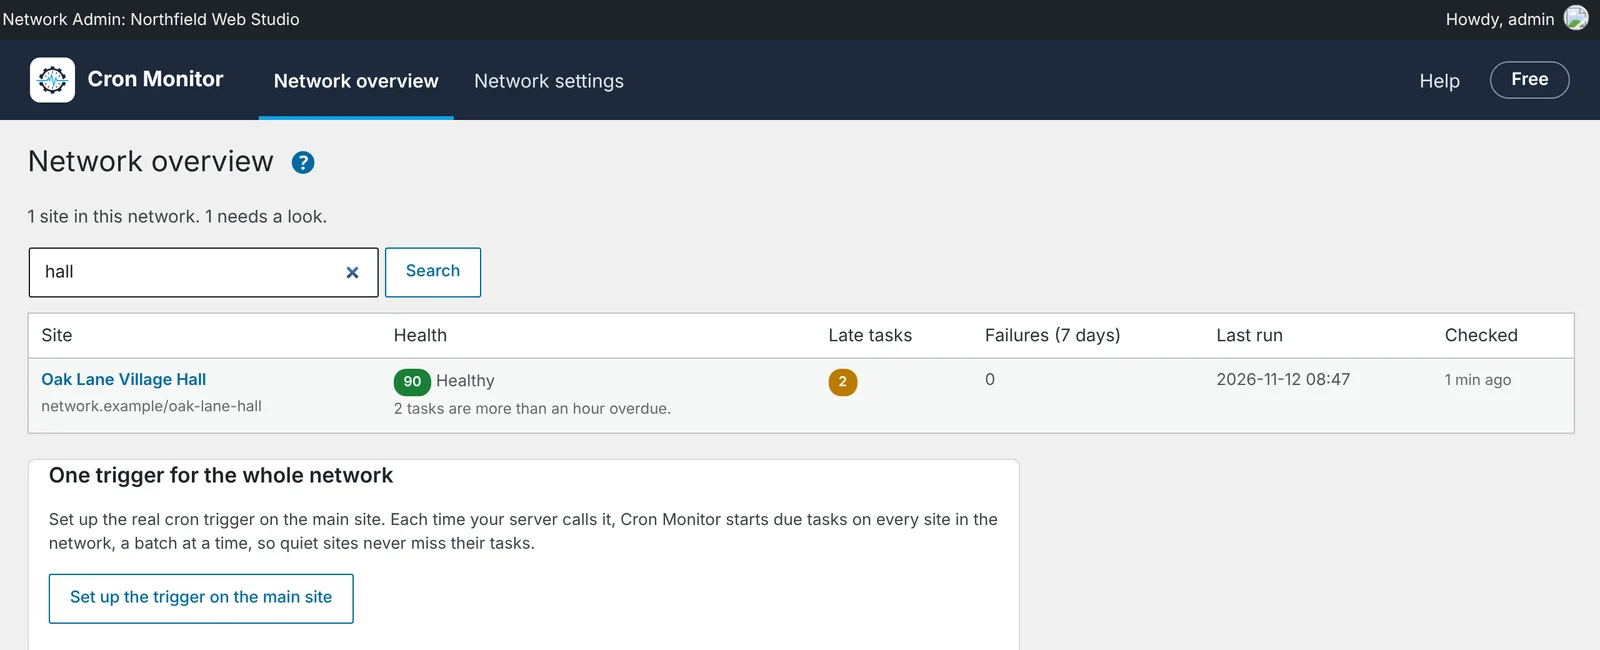
Find a site in a big network
Search by a site's name or address to go straight to it, however many sites the network has.
One real cron trigger for the whole network
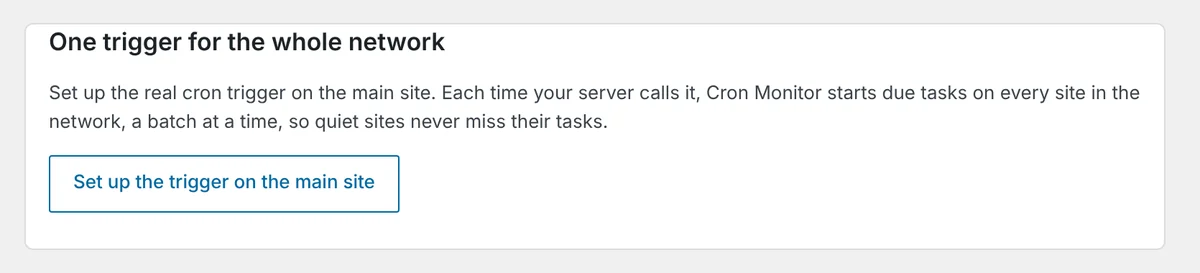
Set up the real cron trigger once, on the main site. Each time your server calls it, Cron Monitor starts the due tasks on every site in the network, a batch at a time, so quiet sites with few visitors never miss their tasks.
- The Setup Wizard on the main site gives you the trigger address and the crontab line.
- New sites set up their run log and stall check by themselves.
- Deleting the plugin cleans up every site.
Set it once for every site
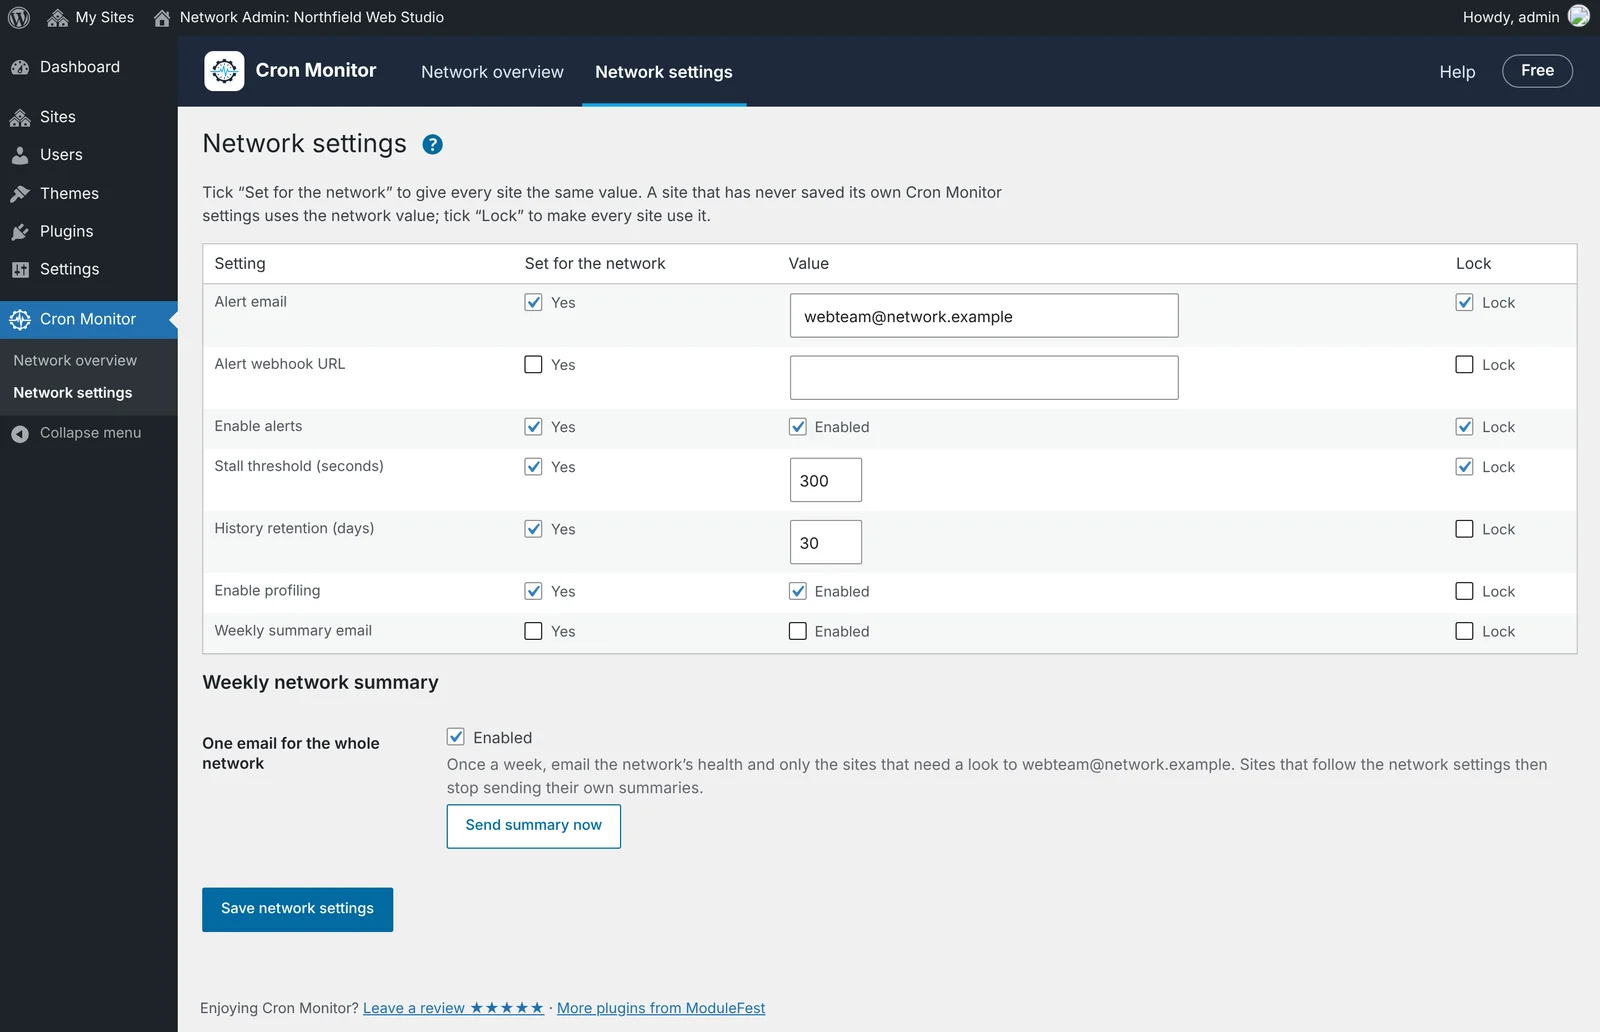
Network settings let you choose the alert email, alert webhook, stall threshold, how long run history is kept, profiling and the weekly summary for the whole network. A site that has never saved its own Cron Monitor settings uses the network's. Tick Lock and every site uses it.
What each site's admin sees
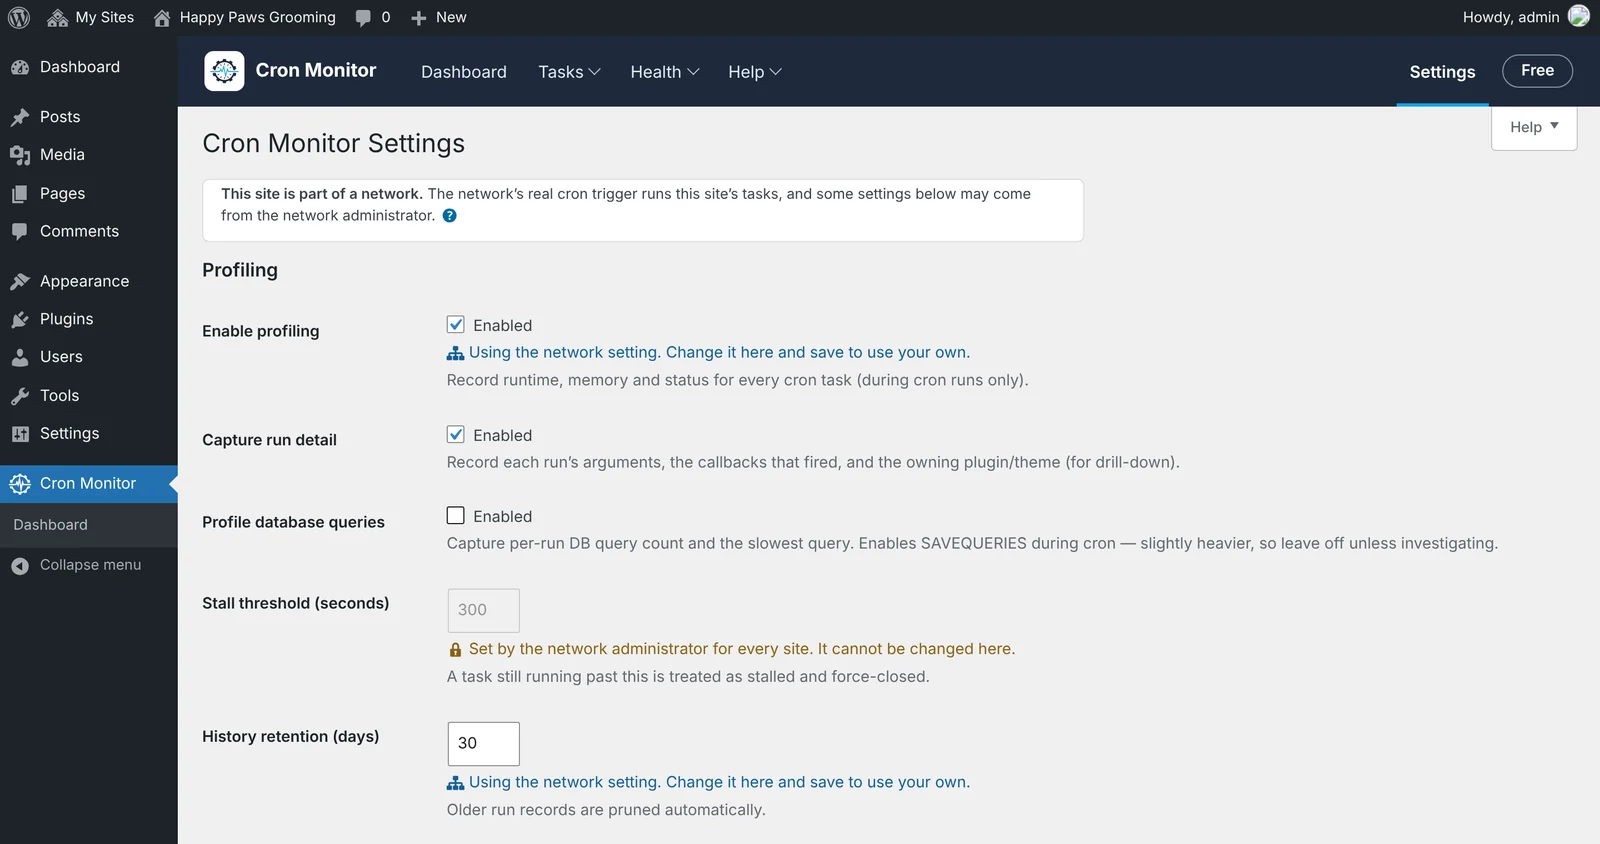
On each site, Cron Monitor's Settings say which values come from the network. Locked settings are greyed out with a note. The others show that they follow the network, and a site's admin can change them for their own site.
One weekly email for the network
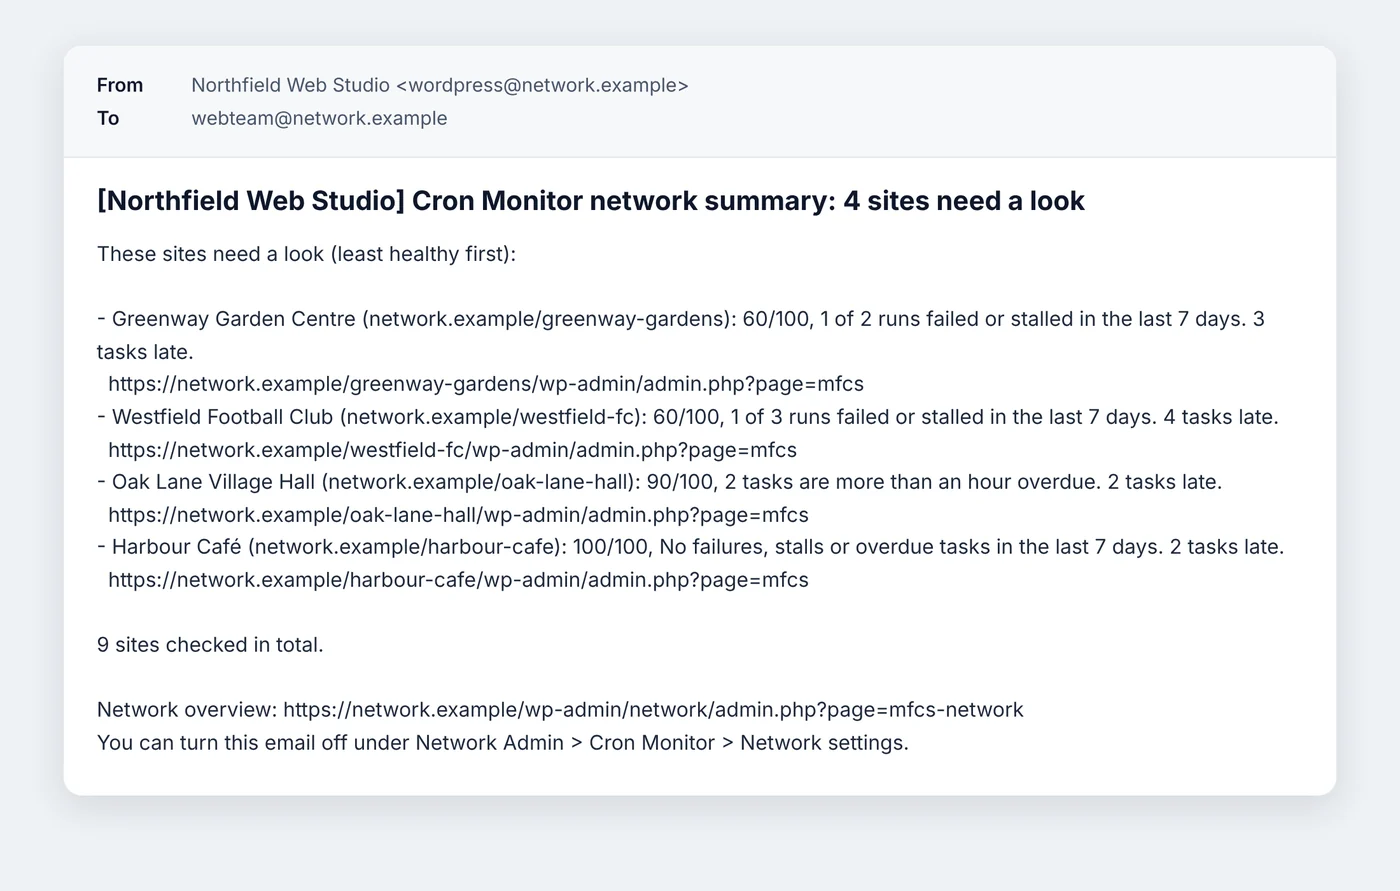
Instead of an email from every site, turn on the weekly network summary. It lists only the sites that need a look, least healthy first, each with a link to its Cron Monitor. Sites that follow the network settings stop sending their own summaries. Send one now from Network settings to see it.
From the command line too
Check or run the whole network with WP-CLI:
wp cronmonitor health --network
wp cronmonitor run --network
Also in 1.15, for agencies
Looking after client sites that are not on one network? 1.15 has tools for that too:
- Each client site can switch on a read-only status link, protected by a secret key.
- See every client site's scheduled-task health in one Agency overview.
- Get an alert when a client site's tasks go unhealthy, with the client named in alerts and summaries.
- Print or save a one-page health report for a client.
Getting it
Multisite support is in Cron Monitor 1.15 and later. Update from Plugins › Updates, or install it free from WordPress.org, then network-activate it in Network Admin › Plugins to see the network screens. On a single site, nothing changes.
New since then
- 1.26.2: Shared chat cards hardcode Cron Monitor as the Discord sender; Cron Monitor keeps old alert email and webhook after another tool changes the shared ones
- 1.23.0: Am warned when a repeating task stops running; Spot tasks that are getting slower; Export run history as a CSV
- 1.20.0: See a 24-hour timeline of when tasks will run; Set quiet hours for heavy tasks; Share a read-only status page with a client
- 1.18.0: Open a page for each task with its history and chart; See Cron Monitor's health on the WordPress Dashboard
- 1.17.1: Remove leftover tasks from plugins I switched off or deleted; See 14-day trend charts on the Dashboard; Leftover tasks listed tasks from active plugins that only load their code during cron
Release notes
1.15.1November 12, 2026
Site names with an apostrophe now read correctly in the weekly network summary email. A name such as St Mary's FC used to show a code in place of the apostrophe; it now reads as it does in WordPress.
To see it on a multisite network:
- Go to Network Admin › Cron Monitor › Network settings.
- Under Weekly network summary, press Send summary now.
- Open the email and check the site names.
There is nothing to change: the next weekly summary uses the corrected names.
1.15.0November 12, 2026
You can now securely share your website's cron health status with your agency without exposing any sensitive data. Go to Tools > Cron Monitor to find the new settings.
- Turn on the status link toggle to generate your unique address and secret key.
- Copy and share both details with your agency so they can monitor your site's cron health.
- Generate a new secret key or switch off the link entirely at any time to immediately revoke external access.
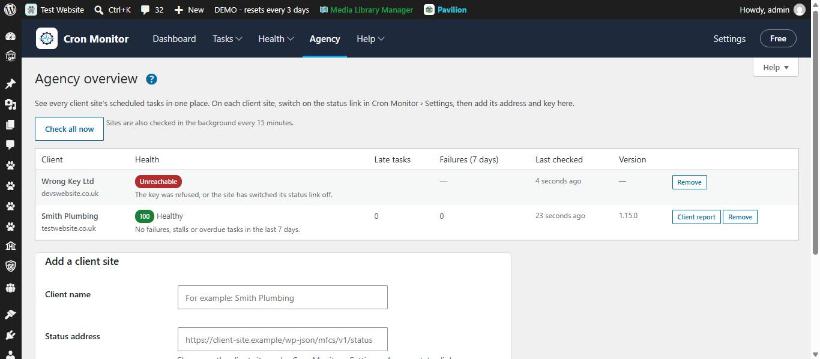
You can now monitor the cron health of all your client websites in one centralized dashboard. Find this feature by going to Cron Monitor > Agency overview.
- Enter your client name, status address, and key into the provided fields to add the site.
- View your connected websites in a single grid automatically sorted with the least healthy sites at the top.
- Review health statuses, late tasks, failures, last checked times, and plugin versions at a glance.
- Edit or remove existing client sites using the management options next to each entry.
You can now receive instant alerts when a client site's background tasks become unhealthy or go offline.
Find this in Main Menu > Agency > Settings > Alerts.
- Scroll to the client site notifications section.
- Enable email or webhook alerts for site health changes.
- Save your changes to start receiving notifications when a site needs attention or recovers.
You can now personalize your alert emails and weekly summaries with a custom client or site name.
Find this in Settings > General.
- Enter your preferred client or site name in the designated field.
- Save your changes.
Alerts, webhooks, and weekly summaries will now lead with this name, defaulting to your standard site title if left blank.
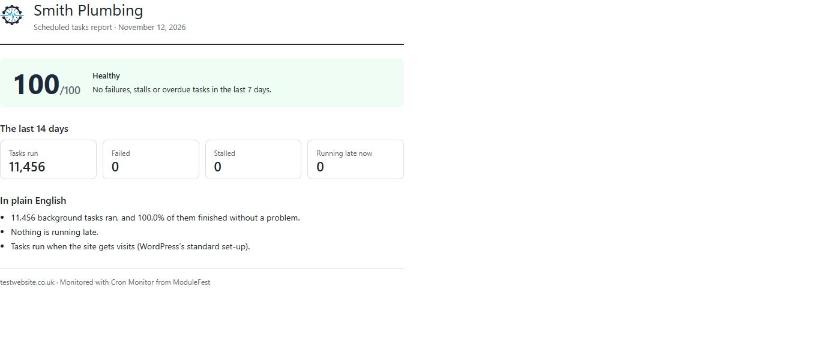
You can now easily generate, print, and save a clean, one-page cron health report to share with your clients.
You can find this feature in two places: on your main plugin Dashboard, or per site inside the Agency overview.
- Navigate to the plugin Dashboard or your Agency overview.
- Click the Client Report button.
- Review the health score, recent run history, late tasks, and cron mode.
- Press your browser's print command to print the report or save it as a PDF.
You can now check the health of all your network sites or run due tasks across the whole network at once.
Find it via Tools › Cron Monitor.
- Run health checks or run due tasks for every subsite in one go.
- Get a clear one-line report for each site showing scores, late tasks and failures.
- Output results in JSON format if you use custom scripts.
You can now run scheduled tasks on every site across your network from one place so nothing gets missed.
Go to Tools › Cron Monitor.
- Go to your main network dashboard.
- Open the monitor screen to view every site queue together.
- Set a single trigger to run tasks for all subsites on time.
- Quiet sites now run scheduled posts, emails and clean-ups reliably.
- You no longer need to rely on site visits to run background tasks.
You can now view the cron health of all your separate client sites in one grid on your own agency site.
Find this at Tools › Cron Monitor.
- Go to your agency site and open the settings screen.
- Generate a connection key.
- Paste the key into the plugin settings on each client site to link them.
- You will receive alerts if a cron job fails on any connected site.
- You can generate simple reports for your clients directly from the grid.
- Your data goes straight between your sites with no middle service.
ModuleFest Cron Monitor
The control tower for your site's scheduled tasks.
More news
 New featurePet Groomer 2.77: Account credit and monthly billingManage advance payments and bill chosen clients just once a month.See what's new →
 New releaseModuleFest Pet Walker 2.771.222Customers can now pay in advance and have their invoices paid from the balance. Also in this release: pay monthly in arrears: one invoice at the…See what's new →
 New releaseModuleFest Trades Business Manager 0.14.42Jobs, quotes, invoices and stock for tradesSee what's new →