









 Nieuwe functie
Houd elke site in een multisite-netwerk in de gaten
ModuleFest Cron Monitor 1.15 brengt multisite-ondersteuning. Voer de geplande taken van elke site uit met één echte cron-trigger, zie de gezondheid van elke site op één scherm in Netwerkbeheer, stel meldingen en limieten één keer in voor het hele netwerk en ontvang één wekelijkse e-mail met alleen de sites die aandacht nodig hebben.
Elke site op één scherm
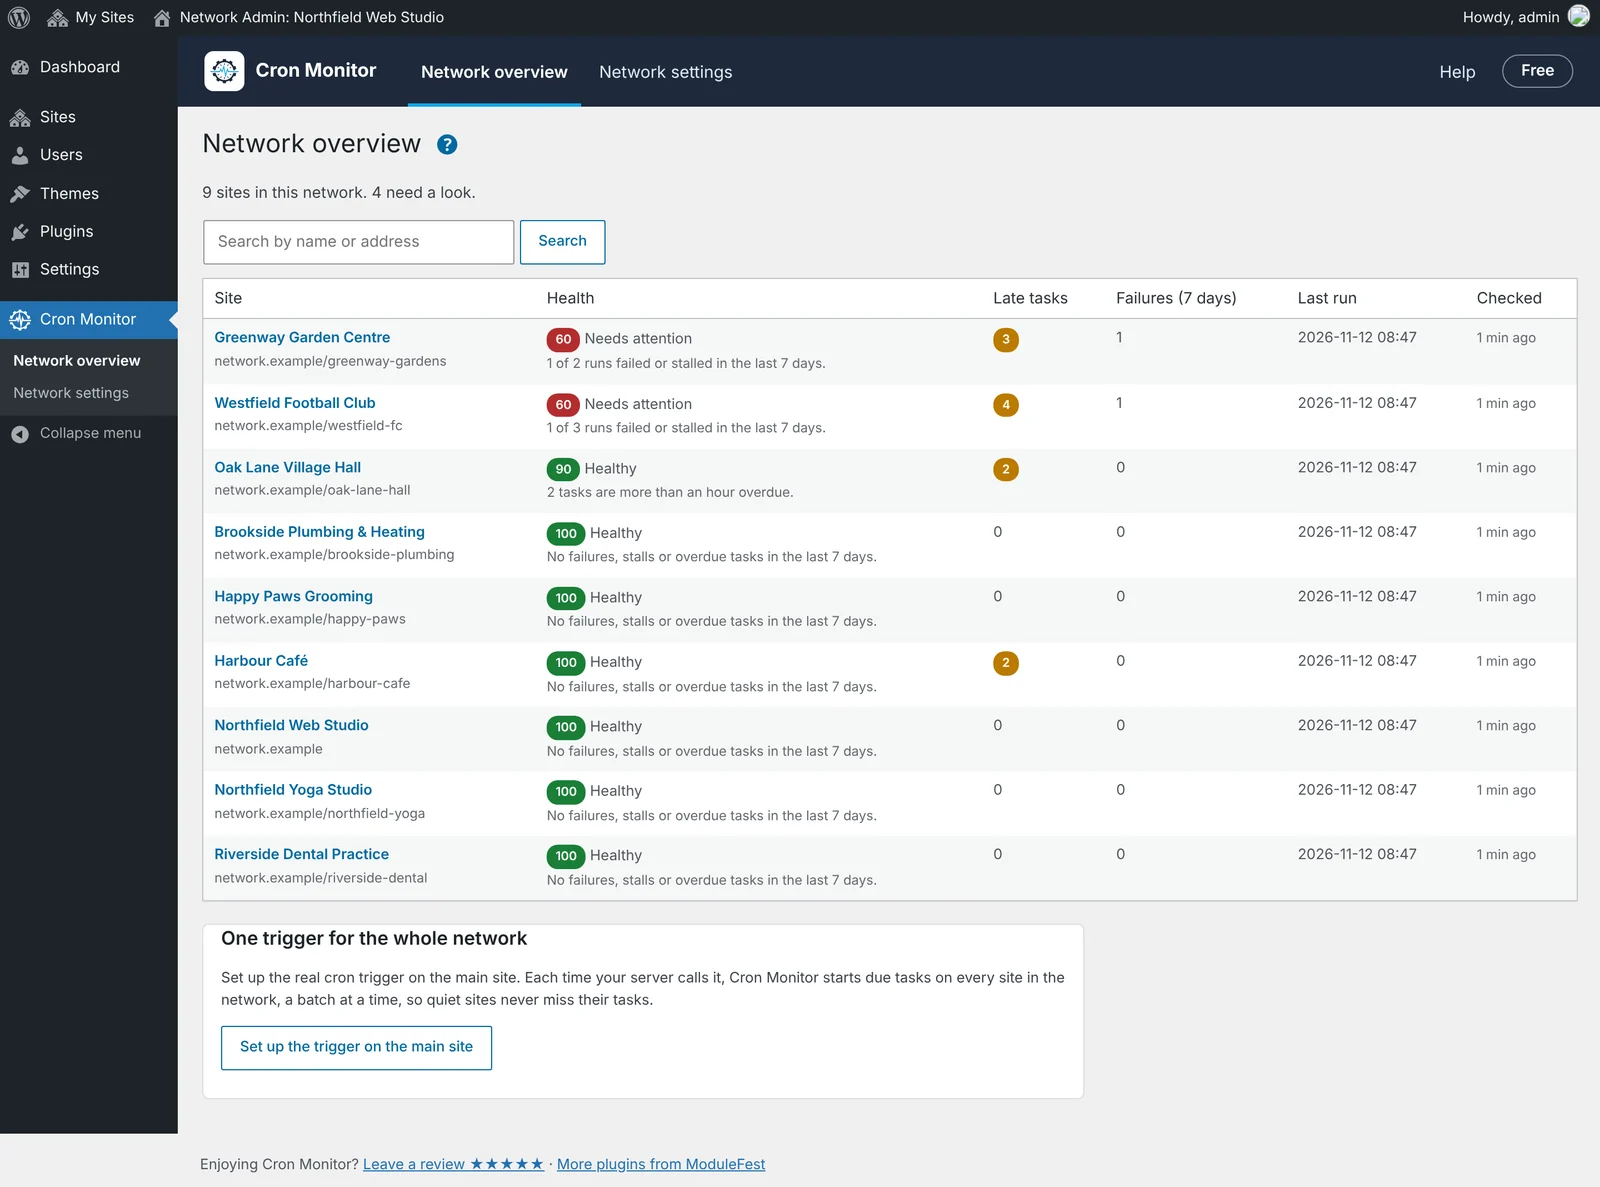
Network Admin › Cron Monitor toont elke site in uw netwerk met de gezondheidsscore, te late taken, fouten van de afgelopen 7 dagen en wanneer de taken voor het laatst liepen. De minst gezonde sites staan bovenaan, zodat u meteen ziet waar u moet kijken.
- Een gezondheidsscore voor elke site, met de reden in gewone woorden.
- Te late taken en fouten geteld voor elke site.
- Open de Cron Monitor van elke site direct vanuit de rij.
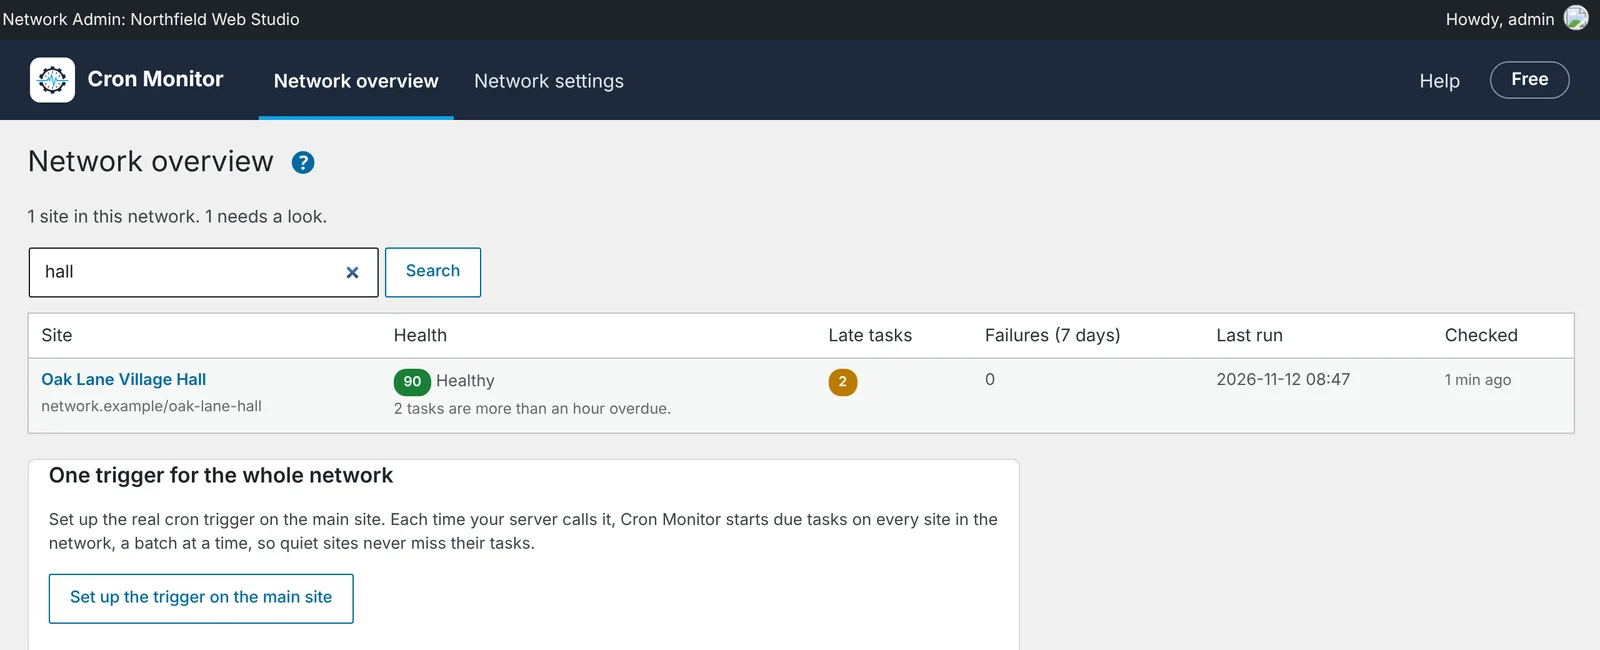
Een site vinden in een groot netwerk
Zoek op de naam of het adres van een site om er direct naartoe te gaan, hoeveel sites het netwerk ook heeft.
Eén echte cron-trigger voor het hele netwerk
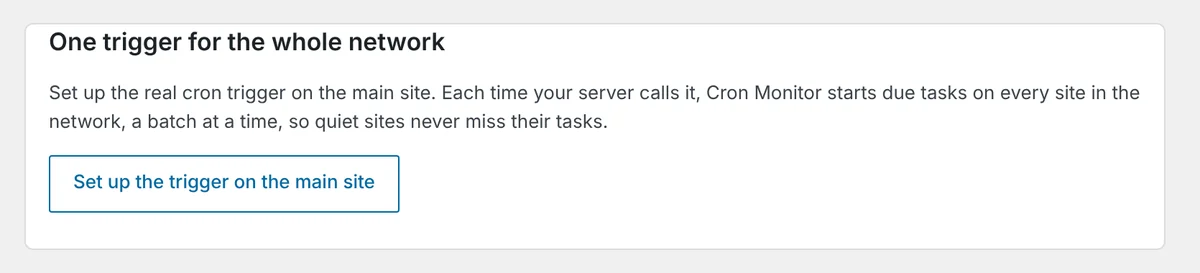
Stel de echte cron-trigger één keer in, op de hoofdsite. Elke keer dat uw server hem aanroept, start Cron Monitor de taken die aan de beurt zijn op elke site in het netwerk, per groep, zodat rustige sites met weinig bezoekers nooit een taak missen.
- De installatiewizard op de hoofdsite geeft u het trigger-adres en de crontab-regel.
- Nieuwe sites richten zelf hun uitvoeringslog en vastloopcontrole in.
- Bij het verwijderen van de plugin wordt elke site opgeruimd.
Eén keer instellen voor elke site
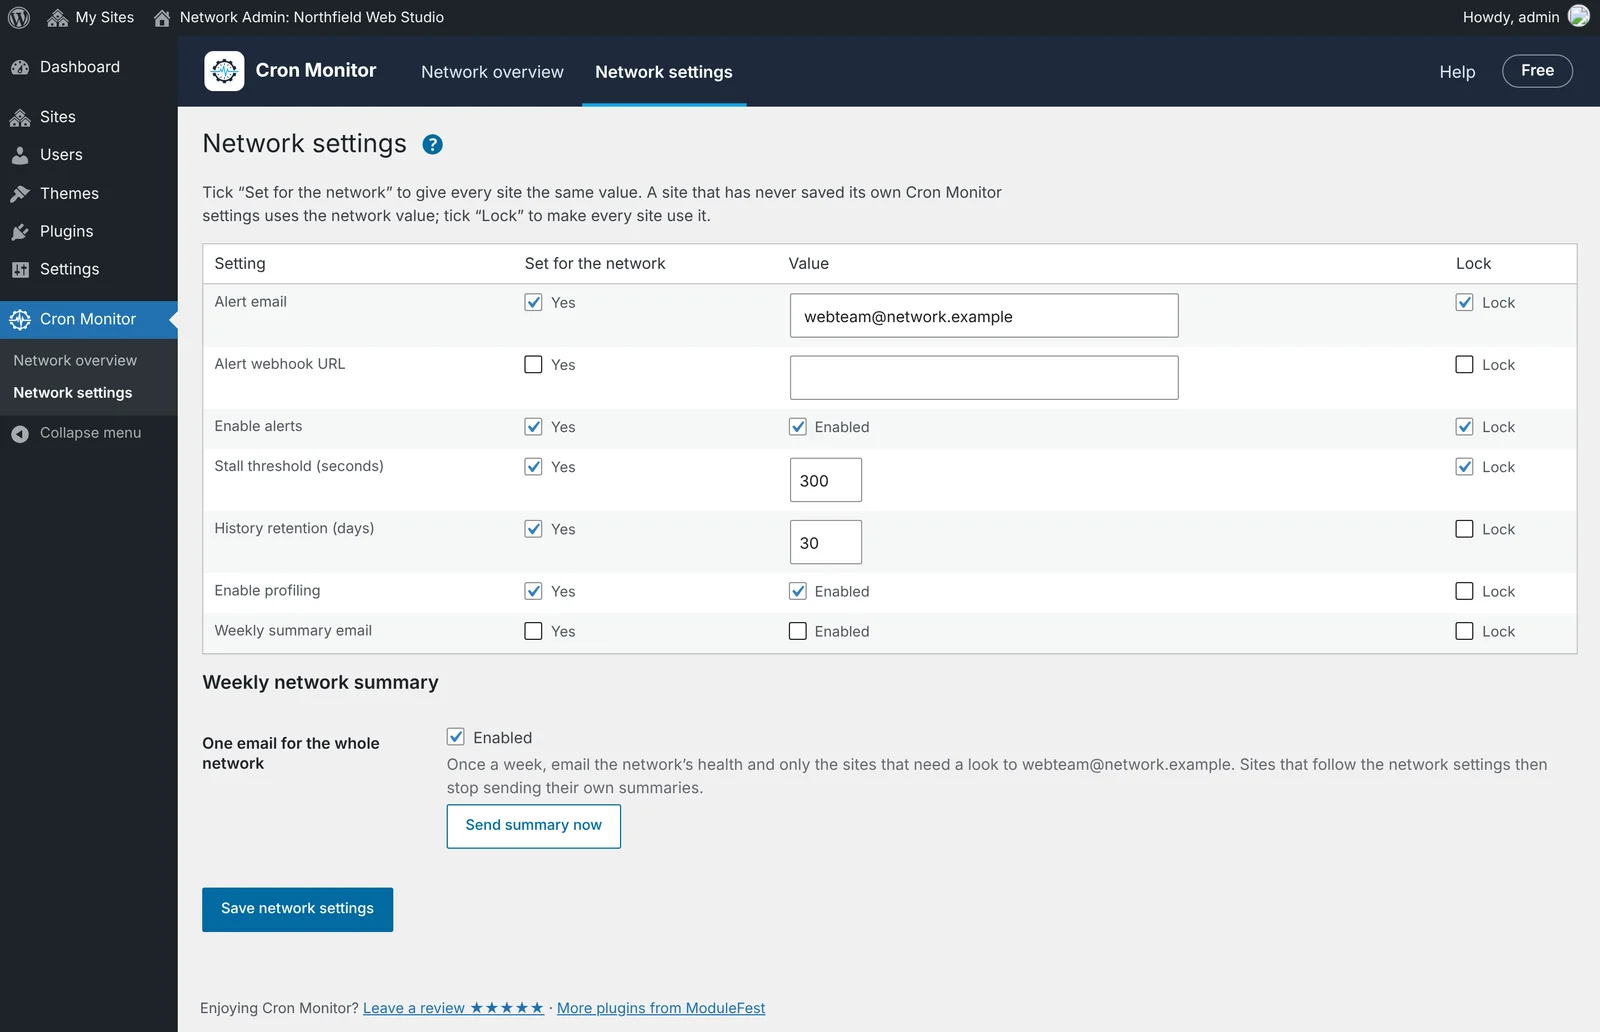
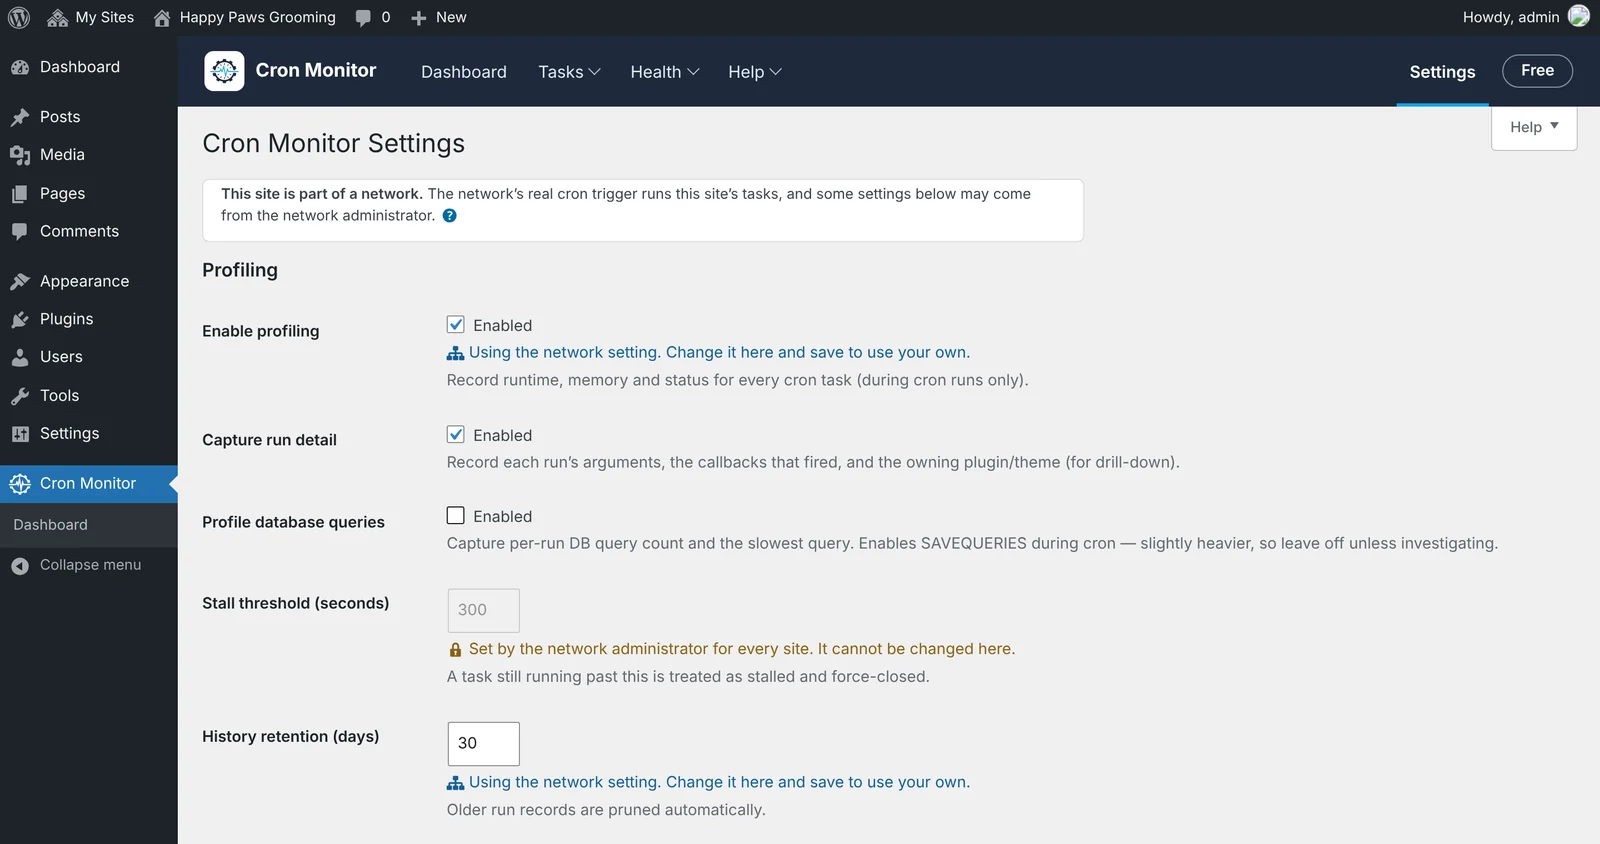
Met de netwerkinstellingen kiest u het meldings-e-mailadres, de meldings-webhook, de vastloopdrempel, hoe lang de geschiedenis bewaard blijft, profilering en de wekelijkse samenvatting voor het hele netwerk. Een site die nooit eigen Cron Monitor-instellingen heeft opgeslagen, gebruikt die van het netwerk. Vink „Lock” aan en elke site gebruikt ze.
Wat de beheerder van elke site ziet
Op elke site tonen de instellingen van Cron Monitor welke waarden van het netwerk komen. Vergrendelde instellingen zijn grijs met een opmerking. De andere tonen dat ze het netwerk volgen, en de beheerder van de site kan ze voor de eigen site wijzigen.
Eén wekelijkse e-mail voor het netwerk
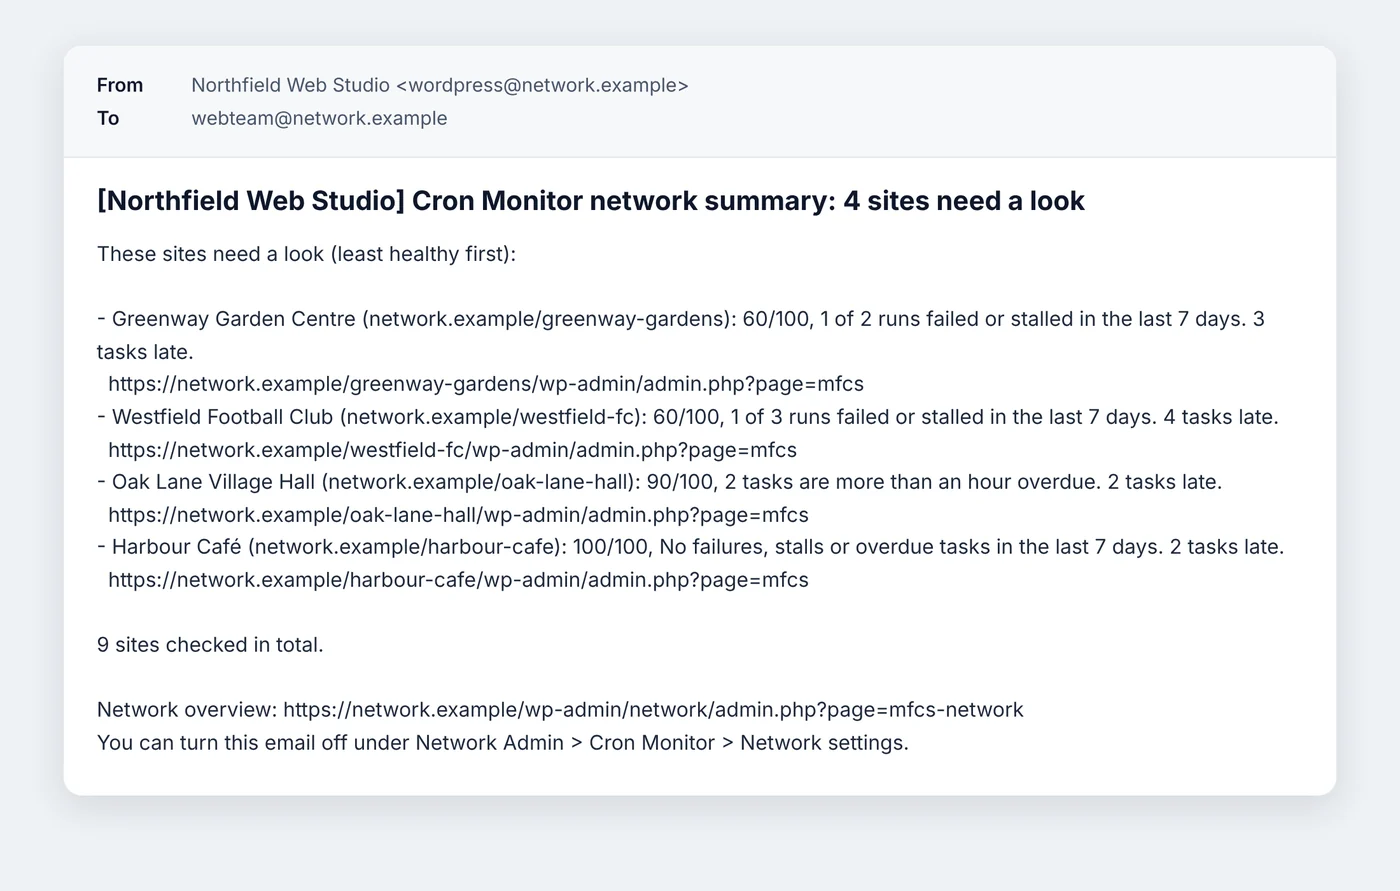
Zet in plaats van een e-mail van elke site de wekelijkse netwerksamenvatting aan. Daarin staan alleen de sites die aandacht nodig hebben, de minst gezonde eerst, elk met een link naar de eigen Cron Monitor. Sites die de netwerkinstellingen volgen, sturen geen eigen samenvattingen meer. Stuur er meteen een vanuit de netwerkinstellingen om hem te zien.
Ook via de opdrachtregel
Controleer of start het hele netwerk met WP-CLI:
wp cronmonitor health --network
wp cronmonitor run --network
Ook in 1.15, voor bureaus
Beheert u klantsites die niet in één netwerk zitten? 1.15 heeft daar ook hulpmiddelen voor:
- Elke klantsite kan een alleen-lezen statuslink aanzetten, beschermd met een geheime sleutel.
- Zie de gezondheid van de geplande taken van alle klantsites in één bureauoverzicht.
- Krijg een melding wanneer de taken van een klantsite niet meer gezond zijn, met de klantnaam in meldingen en samenvattingen.
- Druk een gezondheidsrapport van één pagina af voor een klant of sla het op.
Zo krijgt u het
Multisite-ondersteuning zit in Cron Monitor 1.15 en later. Werk bij via Plugins › Updates, of installeer het gratis vanaf WordPress.org, en activeer het netwerkbreed in Network Admin › Plugins om de netwerkschermen te zien. Op een losse site verandert er niets.
Sindsdien nieuw
- 1.26.2: Gedeelde chatkaarten tonen nu de juiste afzender in plaats van Cron Monitor; Cron Monitor behoudt nu waarschuwingen na wijzigingen in andere tools
- 1.23.0: Am warned when a repeating task stops running; Spot tasks that are getting slower; Export run history as a CSV
- 1.20.0: See a 24-hour timeline of when tasks will run; Set quiet hours for heavy tasks; Share a read-only status page with a client
- 1.18.0: Open a page for each task with its history and chart; See Cron Monitor's health on the WordPress Dashboard
- 1.17.1: Remove leftover tasks from plugins I switched off or deleted; See 14-day trend charts on the Dashboard; Leftover tasks listed tasks from active plugins that only load their code during cron
Releaseopmerkingen
1.15.1November 12, 2026
Site names with an apostrophe now read correctly in the weekly network summary email. A name such as St Mary's FC used to show a code in place of the apostrophe; it now reads as it does in WordPress.
To see it on a multisite network:
- Go to Network Admin › Cron Monitor › Network settings.
- Under Weekly network summary, press Send summary now.
- Open the email and check the site names.
There is nothing to change: the next weekly summary uses the corrected names.
1.15.0November 12, 2026
You can now securely share your website's cron health status with your agency without exposing any sensitive data. Go to Tools > Cron Monitor to find the new settings.
- Turn on the status link toggle to generate your unique address and secret key.
- Copy and share both details with your agency so they can monitor your site's cron health.
- Generate a new secret key or switch off the link entirely at any time to immediately revoke external access.
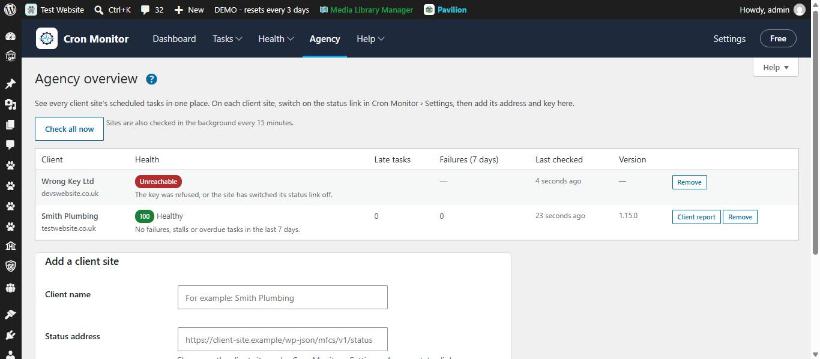
You can now monitor the cron health of all your client websites in one centralized dashboard. Find this feature by going to Cron Monitor > Agency overview.
- Enter your client name, status address, and key into the provided fields to add the site.
- View your connected websites in a single grid automatically sorted with the least healthy sites at the top.
- Review health statuses, late tasks, failures, last checked times, and plugin versions at a glance.
- Edit or remove existing client sites using the management options next to each entry.
You can now receive instant alerts when a client site's background tasks become unhealthy or go offline.
Find this in Main Menu > Agency > Settings > Alerts.
- Scroll to the client site notifications section.
- Enable email or webhook alerts for site health changes.
- Save your changes to start receiving notifications when a site needs attention or recovers.
You can now personalize your alert emails and weekly summaries with a custom client or site name.
Find this in Settings > General.
- Enter your preferred client or site name in the designated field.
- Save your changes.
Alerts, webhooks, and weekly summaries will now lead with this name, defaulting to your standard site title if left blank.
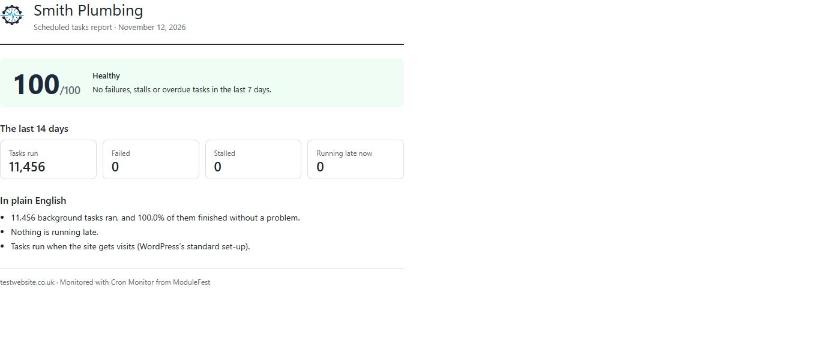
You can now easily generate, print, and save a clean, one-page cron health report to share with your clients.
You can find this feature in two places: on your main plugin Dashboard, or per site inside the Agency overview.
- Navigate to the plugin Dashboard or your Agency overview.
- Click the Client Report button.
- Review the health score, recent run history, late tasks, and cron mode.
- Press your browser's print command to print the report or save it as a PDF.
You can now check the health of all your network sites or run due tasks across the whole network at once.
Find it via Tools › Cron Monitor.
- Run health checks or run due tasks for every subsite in one go.
- Get a clear one-line report for each site showing scores, late tasks and failures.
- Output results in JSON format if you use custom scripts.
You can now run scheduled tasks on every site across your network from one place so nothing gets missed.
Go to Tools › Cron Monitor.
- Go to your main network dashboard.
- Open the monitor screen to view every site queue together.
- Set a single trigger to run tasks for all subsites on time.
- Quiet sites now run scheduled posts, emails and clean-ups reliably.
- You no longer need to rely on site visits to run background tasks.
You can now view the cron health of all your separate client sites in one grid on your own agency site.
Find this at Tools › Cron Monitor.
- Go to your agency site and open the settings screen.
- Generate a connection key.
- Paste the key into the plugin settings on each client site to link them.
- You will receive alerts if a cron job fails on any connected site.
- You can generate simple reports for your clients directly from the grid.
- Your data goes straight between your sites with no middle service.
ModuleFest Cron Monitor
The control tower for your site's scheduled tasks.
Meer nieuws
 Nieuwe functiePet Groomer 2.77: Account credit and monthly billingManage advance payments and bill chosen clients just once a month.Bekijk wat er nieuw is →
 Nieuwe versieModuleFest Pet Walker 2.771.222Klanten kunnen nu vooruitbetalen en hun facturen vanuit het saldo laten betalen. Ook in deze versie: pay monthly in arrears: one invoice at the end of…Bekijk wat er nieuw is →
 Nieuwe versieModuleFest Trades Business Manager 0.14.42Jobs, quotes, invoices and stock for tradesBekijk wat er nieuw is →